
Welcome to Wealth Wisdom
We are thrilled to introduce you to our brand-new series, Wealth Wisdom, wherein we will dive deep into the sea of market data to bring you valuable insights and wisdom gained from analysis of years of stock market data. Our goal? To help you enhance your wealth by treading on the path of data driven insights and decision making. In our inaugural post in this Wealth Wisdom series, we will dive deeper into RSI (Relative Strength Index), a very popular technical indicator.
In case you have missed out on the action since our launch around Diwali 2024, you can glance through a comprehensive compilation of Updates since our launch.
The Relative Strength Index (RSI): A Timeless Indicator
Before we shine a spotlight on RSI, one of the most beloved indicators in the financial world, let us review some background context.
What Is RSI?
RSI was developed by J. Welles Wilder Jr. back in 1978, in his book ‘New Concepts in Technical Trading Systems‘. As one can imagine, RSI and the theories around usage of RSI were developed in a time when data, technology and analytics were not as advanced as today. Despite numerous advancements in analytics and acknowledgement of its shortcomings, RSI remains a go-to tool for traders worldwide.
It is a momentum oscillator that measures the speed and change of price movements, on a scale ranging from 0 to 100. Traditionally, it is believed that an RSI above 70 indicates an “overbought” condition, while an RSI below 30 suggests an “oversold” scenario. There are other ways in which RSI is used such as divergence, but let us not divert our attention right now!
Let us first examine the claims regarding overbought and oversold levels of RSI.
Analysis Methodology
In order to validate the classical theories around RSI, we have studied the price movements of NSE-500 stocks from 2010 onwards. This analysis covered a period of almost 15 years and in doing this, we have traversed more than 14 lakh data points, across 500 stocks! We have computed RSI over a time period of 14 days, since this is the most common default parameter.
Baseline
The first step in analyzing returns or validating the classical theories is to establish a baseline or a reference point. Since the RSI is computed based on movements in the previous 14 days, we have taken a look-ahead period of 10 (trading) days (or 2 weeks).
Next, we have taken the highest price over this 10-day window and divided by the closing price (on the day of calculation of RSI) to arrive at the maximum potential returns over the 10-day period.
The average of these returns over the 14 lakh data points is our baseline or benchmark return – which is 7.07% for our analysis.
RSI Overbought and Oversold Analysis – Approach
Now that we have established a baseline, we need to compare returns across different levels of RSI. Instead of just taking the numbers 30 and 70, which could be arbitrary, we have analyzed the entire spectrum of RSI values.
So, we divided the RSI scale of 0 – 100 into 10 bands of 10 points each. We will now determine the returns when RSI was in each of the ten RSI bands – 0-10, 10-20, 20-30, and so on until 90-100.
This will help us validate the age-old belief about RSI levels above 70 and below 30 being overbought and oversold. In addition, it may help us gain new found insights about the impact of RSI range on price movements, since we are going through vast quantum of data.
With that, let’s get into the juicy details!
Is RSI Oversold Below 30?
Firstly, let us compare the returns when RSI is below 30, with the 7.07% returns of the overall market, being defined as the basket of NSE-500 stocks. In our analysis, we find that the average returns are significantly higher at 8.66%, when the RSI is less than or equal to 30.
This demonstrates that the stocks have historically demonstrated a tendency to rise much higher than the broader market, whenever the RSI is less than or equal to 30.
Next, let us review the theory around RSI being overbought beyond 70.
Is RSI Overbought above 70?
As per the classical theory, the stock is overbought if RSI goes beyond 70.
So, let us compare the returns in all cases where RSI was more than or equal to 70 against our benchmark rate of 7.07%.
Are you ready to be surprised?
Our analysis reveals that the return in cases where RSI breached the score of 70 was 8.01%, which is higher than the broader market increase of 7.07%.
So, clearly the data over the last 15 years in the Indian stock market is telling a slightly different story compared to the classical theories around RSI.
There is another school of thought that pegs the threshold level for overbought stocks at RSI levels of 80. Even if we change the RSI level from 70 to 80 in our anlaysis, the directional results do not change. We find that stocks with an RSI or 80 or more, yielded an average potential return of 9.74% compared to the benchmark reference rate of 7.07%
RSI Range and Impact on Returns
So, let us look at the following chart, that shows the RSI range on the X-axis in ten bands of 10, from 0-10 upto 90-100. The y-axis represents the average of the maximum potential returns in all cases when RSI was in the given band.
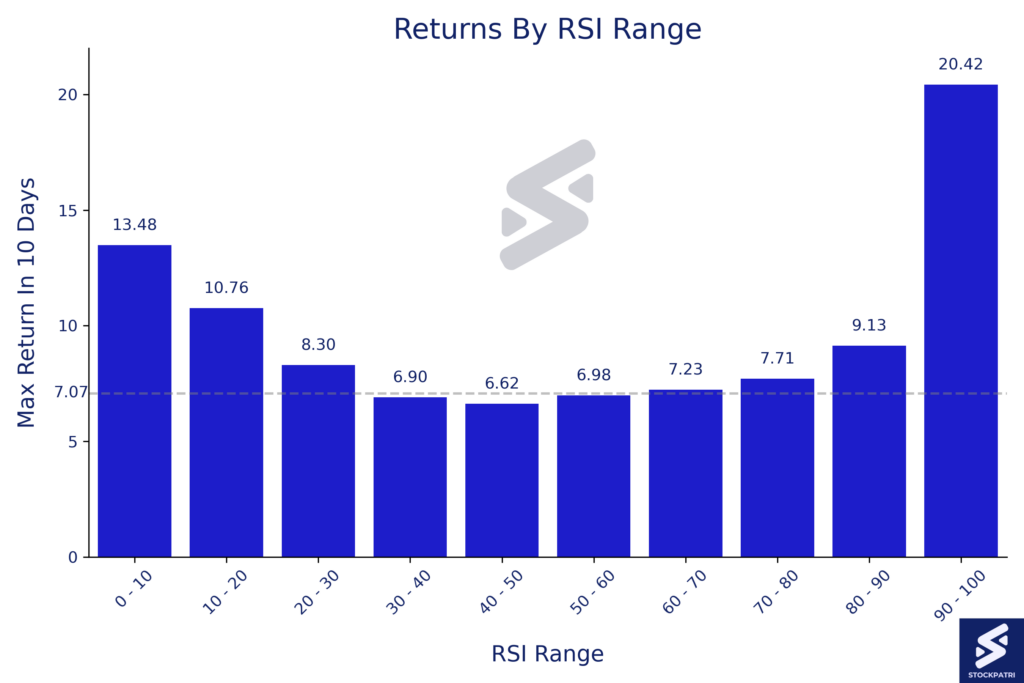
We find an interesting pattern here, that shows that extreme values of RSI result in the stock price rising more than the broader market over a 10-day look-ahead period.
The stocks with RSI trading in the range of 30-60 have not demonstrated the potential to generate returns in excess of the broader market.
Please note that these are averages over a reasonably long period of time, which has seen bullish and bearish phases. The actual results may vary by a variety of factors including but not limited to stock specific factors, market trends, changes in the fundamental nature of the market itself, etc. One needs to take into account all factors before formulating a trading strategy or an investment thesis.
What about downside risk?
We have looked at the upside potential across the entire range of RSI values, but that is only the partial story. In the next post, we will look at the downside potential for each of the RSI bands, to make a fuller assessment of the claims that stock with RSI above 70 is overbought and RSI below 30 is oversold.
Only then, can we conclude whether a stock is overbought above RSI of 70 and is oversold at RSI below 30. Until now, we know that in both cases, the stocks do have upside potential that is higher than the broader market average.
So stay tuned as we continue to unravel the narratives hidden within market data in the next part of our Wealth Wisdom series.
A Final Thought
Remember, this analysis is not intended as investment advice or trading strategy but merely reflects the story told by historical data. Also, the story is not yet complete, and you should read the other posts in this series to understand the complete picture. Typically, seasoned traders and investors do not look at just one metric, but triage information across a variety of sources and indicators. One such powerful indicator that you must consider adding to your watchlist is our StockBal Index, that is updated each day for all the stocks that are traded on NSE in the mainboard segment.
We hope you enjoyed this deep dive into RSI and found it both informative and engaging. Until next time, happy investing!
Stay In Touch – Sign Up to our newsletter now!
Note: Stock market investments are subject to market risks. Past performance is not indicative of future results. The above should not be treated as investment advice. Please read the full disclaimers here.