Wealth Wisdom: Unveiling the Downside of RSI
Welcome back to our series, Wealth Wisdom, where we continue to delve into the depths of market data to bring you insights that can guide your investment and trading journey. In our previous post, we explored the potential upside at various RSI (Relative Strength Index) levels. These surprising insights were uncovered after a comprehensive analysis of over 14 lakh data points of NSE-500 stocks over 15 years. Today, we shift our focus to understanding the downside risks associated with these RSI levels.
In line with our approach, we are providing you with unadulterated data-driven insights. In this Wealth Wisdom series, we are examining the veracity of the classical theories around RSI, one of the most popular technical indicators. It’s time to uncover what lies beneath the surface of technical indicators and whether the classical theories that we trust and use for decision making, hold their own when tested against historical data.
Quick Recap: Our Analysis Methodology
Before we dive into the details, let’s quickly revisit the methodology that we had explained in detail in our previous post on the upside potential of RSI. We analyzed the price movements of NSE-500 stocks over a period of almost 15 years, computing the RSI over a 14-day period, and this gave us a fertile ground of over 14 lakh data points to comprehensively test the classical theories around RSI.
We divided the RSI scale (from 0 to 100) into ten equal bands, and we examined how stocks performed within each range. In the previous post, we looked at the upside potential over the next 10 days i.e percentage difference between the highest high over the next 10 days and the close on the day of the RSI reading. Our aim is to test the validity of the classical theories by comparing returns across these RSI levels against the market returns. We compared the potential returns generated across all RSI levels with the 7.07% benchmark for the analysis, which was the average potential upside across all stocks during this period.
Measuring Downside Risks
For the analysis of downside risk, we continue with the same period, dataset and the measurement methodology of RSI. However, we invert the method of measuring the returns. Since our attention is now on the downside, instead of the highest high, we will measure the lowest low over the next 10 days from the date of the RSI reading. This is compared against the closing price on the day of the RSI reading, and the fall, or downside potential over the next day 10 days is expressed as a percentage of the closing price.
The average value of this negative return, or downside risk across the entire data set is -5.37%, which effectively becomes our benchmark for this study. As you will observe, the average upside of 7.07% is more than the absolute value of the average downside of 5.37% over the last 15 years, since the broader markets have increased significantly during this period.
RSI: Overbought or Oversold?
As outlined in the previous post, there are several ways of interpreting RSI values, and in this series, we are directing our attention on the overbought and oversold levels. As per the classical theory, a stock is considered to be overbought above RSI of 70, and oversold below RSI of 30. But, is this assertion valid?
Let us dive straight into the results of our analysis, and find out for ourselves.
Higher Downside Above RSI 70
In our analysis, we found that when RSI exceeds 70, the downside potential over the next 10 days is -5.81%, as compared to the average downside potential of -5.37%.
This implies that the downside risk is indeed higher than the market average when RSI is above 70. So, even though the previous analysis of upside suggests that these stocks have a higher upside compared to the broader market, they are also susceptible to larger declines.
Even Larger Downside Below RSI 30
The downside potential of stocks when RSI is below 30 may surprise some of you.
When RSI falls below 30, indicating an “oversold” state as per classical theories, our analysis revealed that the downside risk is even more pronounced.
The average 10 day downside potential when RSI is below 30 moves to a staggering -7.52%, as compared to the reference rate of -5.37%.
As you would notice, this is a mirror image of the upside potential at RSI levels of less than 30, where upside potential was higher than average. So, at lower RSI levels, both upside and downside potential are higher than the average market.
Downside Risk Analysis Across The Entire RSI Spectrum
Why restrict ourselves to 2 arbitrary numbers – 30 and 70? Let us examine the downside potential across all possible values of RSI from 0 to 100. So, here is a chart showcasing the downside risks across the entire spectrum of RSI bands, starting from 0-10 and going all the way to RSI values between 90-100.
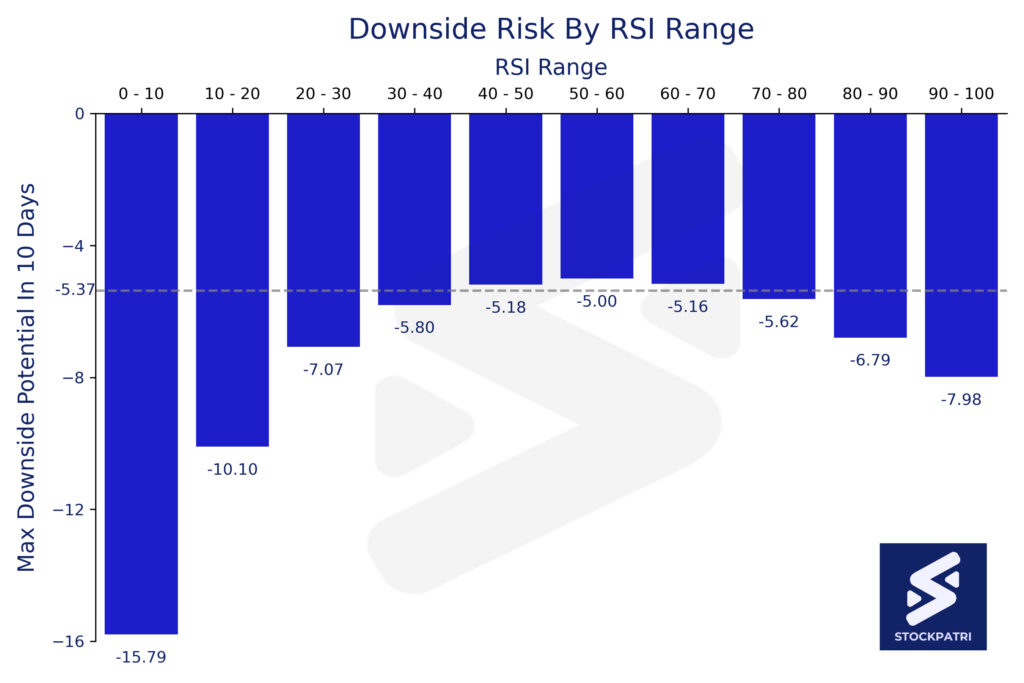
We find that the pattern is quite consistent across the entire spectrum of RSI values. Extreme values of RSI are associated with the stock price falling more than the broader market over a 10-day look-ahead period.
On the other hand, the stocks trading with RSI in the range of 40-70 have demonstrated the potential to fall lower than the broader market.
Are Stocks Overbought or Oversold Based on RSI Levels?
The downside risk pattern appears to mirror the potential upside pattern that we observed in our previous post on RSI overbought and oversold levels. Extreme RSI values are associated with larger fluctuations, with both increased upside potential and significant downside risks. This appears to be true for RSI below 30 and also for RSI above 70.
So, can we validate the classical theory that RSI is “overbought” below 30 and “oversold” above 70?
Not quite.
The analysis of these 14 lakh data points from 500 stocks over almost 15 years shows that both these cases of extreme RSI values can result in both higher upside and also larger downside, as compared to the broader market average.
The key takeaway here is that we need to evaluate the net result after considering both positive and negative returns, balancing risk and reward.
Balancing Upside and Downside Risks
And, that is exactly what we will be doing in the next post of our Wealth Wisdom series, where we will present our findings of the risk-reward equation or the net returns.
We trust that you find value in the StockPatri approach of rigorously analyzing tons of data points to validate, or, as the case may be, invalidate and re-write classical theories.
If you find this useful, please share it with like minded people. In this world of algorithm-driven content consumption, fake narratives often spread like wildfire, while truth is the casualty. And, this is one of the factors that leads to over 90% of retail participants losing money in the stock market. So, we are counting on you to help each other by sharing authentic data-driven insights.
And, congratulations for being a part of this historical journey, as we are effectively re-writing the classical understanding and interpretation of technical indicators such as RSI and other classical theories.
We will continue to bring more such data-driven insights and reports for your benefit, and trust that you find our proprietary StockBal Index simple, useful and valuable.
However, please note that the summary results represent averages over 500 stocks over a reasonably long period of time, that have seen both bullish and bearish phases. The actual risks may vary based on stock specific factors, market trends, changes in the fundamental nature of the market itself, etc.
One needs to take into account many factors before formulating a trading strategy or an investment thesis, and any one indicator or method can at best, provide a partial insight into the broader market or into any stock, commodity or asset class.
What is your StockBal?
StockBal is our proprietary index that measures the relative strength of all stocks traded on NSE compared to the broader market and offers a comprehensive view across three different time frames in one single dashboard.
Varshik Bal, Masik Bal and Saptahik Bal (Annual, Monthly and Weekly Stock Bal) are updated at the end of each trading day for all mainboard stocks traded on the NSE.
Stay tuned for more insights as we continue to decode the market in our Wealth Wisdom series, and help you re-write the patri of your finances at SotckPartri!
Stay In Touch – Sign Up to our newsletter now!
Note: Stock market investments are subject to market risks. Past performance is not indicative of future results. The above should not be treated as investment advice. Please read the full disclaimers here.