
Wealth Wisdom – Analysis of StockBal Returns
Welcome to the next segment of the Wealth Wisdom series! We are dedicating the next few posts to explore the relationship of StockPatri’s proprietary StockBal with the potential returns of the underlying stock. We will follow a similar format as we did in the previous segment of Wealth Wisdom, wherein we analyzed the potential returns of stocks across the entire spectrum of Relative Strength Index (RSI), one of the most popular technical indicators.
StockBal – Choose Your Power
We are breaking this series on StockBal into three sections, each dedicated to one of the three time frames on which our proprietary index of relative strength is computed – Varshik Bal (Annual StockBal), Masik Bal (Monthly StockBal) and Saptahik Bal (Weekly StockBal).
In this post, we will get started with Varshik Bal and conduct a thorough analysis of returns across the entire spectrum of values of Varshik Bal, or Annual StockBal.
In case you haven’t checked it out yet, head over to the StockBal Dashboard, where you will find StockBal computed over all three time frames, for all NSE traded stocks, updated on each trading day. Please note that you can search for your stock either by name of the company or by the NSE symbol. However, the search needs to be done inside the dashboard, and not on the site-wide search bar, which is meant for searching content across the contents of our website, such as posts, articles, reports, updates, etc.
Analysis of Returns of Varshik Bal (Annual StockBal)
Let us begin our journey of analysis of returns across the entire spectrum of values of Varshik Bal, or Annual StockBal. In order to do this, we will answer three broad questions over three posts.
In the first post of this series, we will examine the upside potential of stocks across the range of Varshik Bal, and then we will review the potential downside risks in the second post. Finally, in the third part, we will look at the final picture that balances potential risk and rewards.
The methodology and datasets used are quite similar to the approach that we had followed for analysis of returns based on RSI. However, there are some changes, because the Varshik Bal, as the name implies, computes the strength of a stock relative to the broader market, over a period of the previous one year. This is in stark contrast to indicators such as RSI, wherein the indicator is computed based on the previous 14 periods (trading days) only.
So, let us quickly look at the methodology and key reference points, or the baseline for this analysis.
Analysis Methodology
We have used a very comprehensive data-set covering data of more than 14 lakh sets of prices, spanning almost 15 years of end of day trading data for 500 stocks. The rigor of this exercise is very much in line with our overall approach and methodology, of providing data-driven insights that are thoroughly tested and validated using extended datasets, and not just sample data, or one’s intuition or hunch.
Even though we do provide the required disclaimers at the end of this post, please do note that the purpose of this analysis is only to demonstrate the historical relationship between potential returns and the spectrum of Varshik Bal or Annual StockBal values. This is not intended to be investment or trading advice, and one should consult their financial advisors for the same. Also, readers are reminded that even though the past patterns are analyzed thoroughly, there is no guarantee that they are indicative or suggestive of the future performance.
Baseline
The key parameter that we will examine is the potential upside of stocks across the entire spectrum of values of Varshik Bal. In order to do this, we have taken the maximum potential upside of a stock over the next 30 trading days as the reference point or the benchmark.
As you would recall from the analysis of returns of RSI, we had looked ahead into the next 10 trading days only, since the RSI itself was computed on a shorter time frame. In this case, since the Varshik Bal compares movement of a stock over the last one year, relative to the broader market, we have computed potential returns over the next 30 trading days, or roughly 6 trading weeks.
During the period of review from 2010 to 2024, we computed the baseline of the potential 30 day upside that will act as a benchmark for this study. This baseline average upside potential is computed as the maximum of the High prices of the stock over the next 30 trading days. The percentage difference between the maximum High price and the closing price on the day of computation of Varshik Bal is used as the comparison metric.
The average upside potential across all 14 lakh data points over 15 years and 500 stocks is 13.31%. In other words, during this period, the average of the maximum upside potential of stock prices over the next 30 trading days was 13.31%. Now, let us examine how this metric of maximum potential upside behaves across the entire spectrum of values of Varshik Bal.
Varshik Bal and Upside Potential
As you would recall from the StockBal dashboard, the Varshik Bal is computed on a scale of 100, and is categorized into three zones – Low (upto 33.33), Medium (33.33 – 66.66) and High (more than 66.66).
However, for this analysis, we have broken this down at a much more granular level, to understand the patterns better. Since this index has been launched by StockPatri, and you will not find this information on any other platform, we are leaving no stone unturned to dissect the pattern rigorously.
We have split the range of Varshik Bal values into 10 bands of 10 points each, starting from 0-10, and going upto 90-100.
First, let us look at the chart that shows these 10 bands on the X-axis and our target metric i.e. maximum upside potential over 30 days, on the Y-axis.
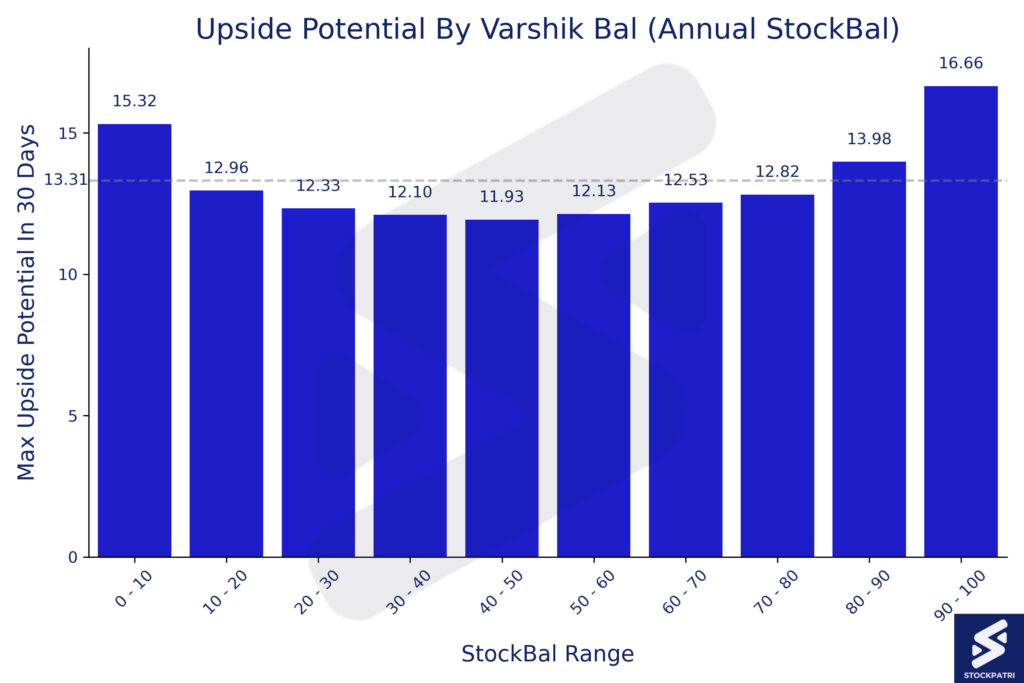
What levels of StockBal are associated with maximum potential upside?
As one can see from the above chart, the upside potential seems to be the highest when the Varshik Bal is higher. At the same time, the upside potential also increases when the Varshik Bal is extremely low.
In particular, take a look at the dotted horizontal line that represents the average upside potential of 13.31%. You will observe that there are only three bands of Varshik Bal values which have generated more upside potential than the average. This happens when the Varshik Bal is more than 80 or is less than 10.
If you want to map these bands to the High, Medium and Low zones of the Varshik Bal that you find on the StockBal dashboard, the upside potential is 14.3% when Varshik Bal is in the ‘High’ zone (StockBal > 66.66), and this is significantly higher than 12.12% for Medium (StockBal between 33.33 and 66.66) and 13.36% for Low Varshik Bal zones (StockBal < 33.33).
As one would intuitively expect by looking at the chart, the upside potential is higher when the needle moves to the right of the mid-point.
The upside potential is 13.62% when the Varshik Bal is more than 50, although it is skewed at the extremes. When the Varshik Bal of a stock is above 95, the average 30 trading day upside potential moves up to an average of 18.1%, a massive increase even if one compares it to the already impressive upside potential of 15.32% when the Varshik Bal is more than 80.
What about downside risk?
We trust you found this insightful, but don’t frame your final conclusions yet. Everything comes at a price, and in the world of investing, one has to take risks of potential downsides, in order to generate returns. We had conducted a similar analysis of downside potential across RSI values in an earlier post.
So, in the next post, we will review the downside risks, before we are able to understand the complete picture of the historical behavior of stock prices at various levels of Varshik Bal.
What about other time frames of StockBal?
Once we complete the exercise with Varshik Bal, we will analyze the StockBal across other time frames as well – namely, Masik Bal and Saptahik Bal (Monthly and Weekly StockBal).
But, first things first!
Let us conclude this post before we proceed to the other aspects of Varshik Bal followed by the other time frames.
A Final Thought
Before we conclude this post, we would like to re-iterate what we mentioned earlier. This analysis is not intended as investment advice or trading strategy, but merely reflects the story told by historical data. Also, the story is not yet complete, and you should read the other posts in this series to understand the complete picture.
Typically, seasoned traders and investors do not look at just one metric, but combine information from a variety of sources and indicators. In the previous segment of Wealth Wisdom, we had analyzed the potential returns across the entire spectrum of RSI values, and demonstrated that the popularly held belief about overbought and oversold RSI zones is not validated by historical data.
The good thing about our StockBal Index is that we do not have to do any unlearning and re-learning, since this is probably the first such index for the Indian markets. While you wait for the next post in this series of Wealth Wisdom, keep an eye on the StockBal Index of your favorite stocks, since it is updated each day for all the stocks that are traded on NSE in the mainboard segment.
We hope you enjoyed this deep dive into Varshik Bal and associated potential returns, and found it informative and insightful. Until next time, happy investing!
Stay In Touch – Sign Up to our newsletter now!
Note: Stock market investments are subject to market risks. Past performance is not indicative of future results. The above should not be treated as investment advice. Please read the full disclaimers here.