
Exploring Risk and Reward Across Varshik Bal Levels
Welcome to the third part of our series, where will analyze the net upside potential associated with various levels of Varshik Bal. In the previous two posts of this series, we have analyzed the upside potential and the downside risk associated with the Varshik Bal or the Annual StockBal, that measures the strength of a stock relative to the broader market over the last one year.
Since the concept of StockBal is new to the Indian market, as it has been introduced by our platform, we are sure these insights will enhance your understanding of the historical performance of a stock. The StockBal dashboard is updated daily for all mainboard NSE stocks with StockBal across three different time frames to provide a comprehensive picture – Varshik Bal (annual), Masik Bal (monthly) and Saptahik Bal (weekly).
In today’s post, we will assess the net upside potential across all levels of the Annual StockBal, balancing the upside potential with the downside risk, that we explored in the previous two posts.
Re-cap: Analysis of Upside Potential and Downside Risk
Let us take a quick tour of what we have covered in the previous posts of our Wealth Wisdom series so far.
Methodology
We strongly believe in a data-driven approach to decision making, and in this study on Varshik Bal, we have followed the same rigor that we did in the three part series on RSI (Relative Strength Index). As you may recollect, we explored the upside potential of RSI, followed by the downside risk and culminating in the net upside. Both these studies (RSI and Varshik Bal) are based on a comprehensive data-set covering over 14 lakh daily price points across 500 stocks!
Our analysis approach has remained consistent across all segments. In each post, we define one hypothesis or analysis goal. We select an appropriate rolling window to measure the target variable, over which we analyze the future price movement. We had taken 10 trading days in case of RSI and 30 trading days in case of Varshik Bal. We then measure the reference value of the target variable, typically as an average of all the 14 lakh data points.
Finally, we analyze the behavior of the target metric across the entire range of values of the indicator or index (such as RSI or Varshik Bal). In order to do this in a meaningful way, we have divided the range of RSI and StockBal values into ten bands of 10 points each, starting from 0-10, and ending with 90-100.
Results of Analysis So Far
In this segment on Varshik Bal, we have already analyzed the upside potential and downside risk in earlier posts. Let us quickly re-visit some of these findings.
In the first post of this segment, we discovered that there are only three bands of Varshik Bal that were associated with returns higher than the average. These three bands were located at the extreme ends of the spectrum – 0-10 on the lower end and 80-100 at the higher end.
In the subsequent post that analyzed the downside risk, we once again observed that there are only three bands of Annual StockBal that are associated with greater downside risks than the average. These three bands are found across both the extreme ends of the spectrum – 0-20 on the lower end and 90-100 at the higher end.
So, if both risk and reward appear to be higher at both lower and higher end of values of the Varshik Bal, what is the net impact? This is precisely what we will cover in this post.
Net Upside Across The Varshik Bal Spectrum
The net impact will be assessed using two target variables – Net Upside and Reward : Risk ratio. Let us first analyze the impact using the Net Upside. This is a simpler metric, as it merely adds the positive upside returns and the negative downside potential in each band of Annual StockBal. The result represents the Net Upside associated with each band of values of Varshik StockBal.
Net Upside By Annual StockBal Levels
The average of the Net Upside metric across the entire universe of ~14 lakh data points is 4.41%. In other words, the average difference between the 30 trading day (~six calendar weeks) upside and the downside is 4.41%.
Now, let us review the Net Upside across the entire spectrum of values of Annual StockBal in the chart below.
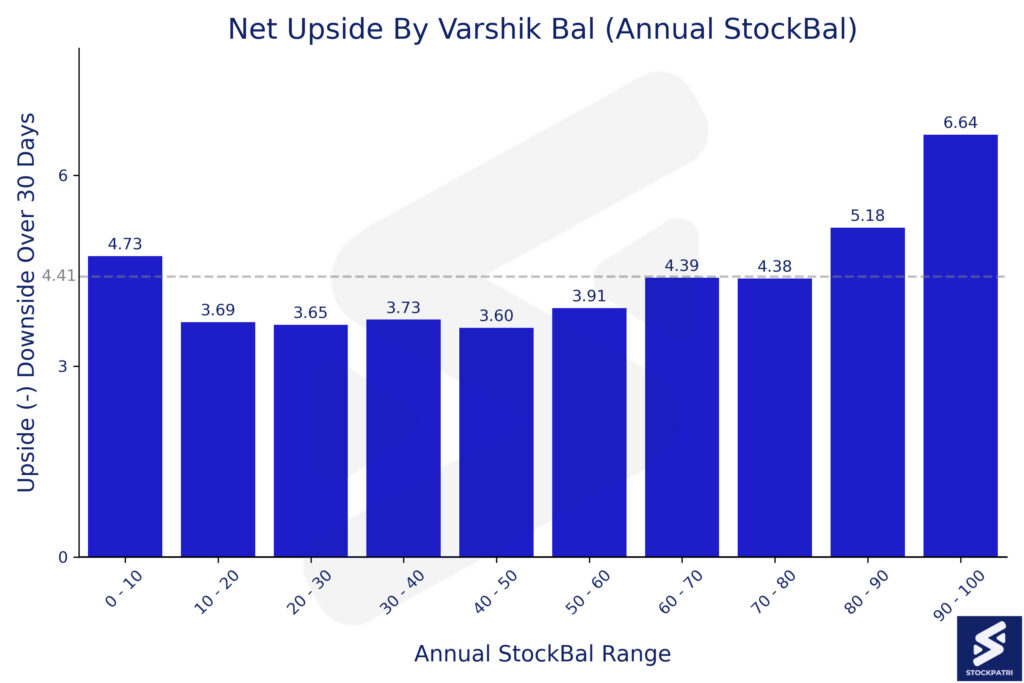
As one can see in the above chart, the Net Upside is higher than the average value in three Varshik Bal bands – 0-10, 80-90 and 90-100. Also, the Net Upside is almost equal to the average when the Varshik Bal is in the range of 60-80.
Let us now look at the second approach of assessing the net impact, before we start drawing conclusions.
Balancing Risk and Reward Using Varshik Bal
In the second approach, we compute the ratio of absolute percentage values of upside potential and downside risk. Effectively, we are measuring units of reward (upside potential) for each unit of risk (downside potential).
The average Reward : Risk ratio across the comprehensive dataset of ~14 lakh data points is 1.5. Now, let us look at the chart below, depicting this ratio across the entire spectrum of values of Varshik Bal.
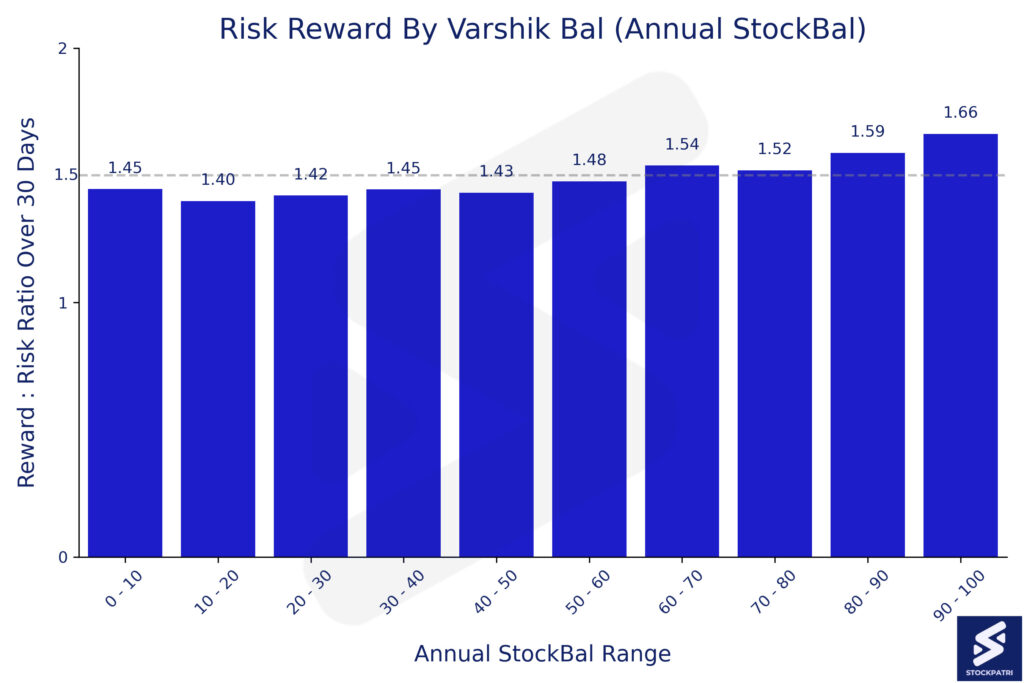
As you can see, there are some commonalities and some differences between the two measures of net impact.
Firstly, let us look at observations that are common across both charts. VarshikBal of 80-100 is associated with net returns that are higher than the market average. On the flip side, VarshikBal of 10-60 is associated with net returns that are lower than the market average.
When VarshikBal is between 60-80, the risk reward ratio is more favorable compared to the average. The net upside is higher than five other bands, but it falls just short of the market average.
When VarshikBal is less than 10, the net upside is more than the average. However, the risk reward equation does not beat the broader market average.
How to use Annual StockBal in your investing and trading strategy?
Before we address the question of how to use the above results or inferences in your investing and trading strategy, there are a few fundamental aspects that we need to consider.
First and foremost, the above analysis only represents the past performance or behavior of a large basket of stocks over a significant period of time. However, as we all know, past performance is not a guarantee of future returns. To add a corollary, past behavior or past patterns may not repeat themselves in the future.
Secondly, there is no single indicator or index that can act as a silver bullet. Typically, one needs to look at several metrics, dimensions or indicators, before taking a decision. After all, it is your heard earned money at stake!
And, finally, please do note that the above rigorous and comprehensive analysis should not be read as investment advice or trading strategy. It narrates the story told by historical data, as viewed through the lens of the Varshik Bal.
So, in a nutshell, when you are looking at the value of the Varshik Bal in the StockBal dashboard going forward, you can benefit from a comparative historical perspective on the average risk and rewards associated with the given value. However, do consult your registered and trusted financial advisor prior to taking investment related decisions.
Final Thoughts
While you wait for the next post in this series of Wealth Wisdom aligned with our data-driven approach, keep an eye on the StockBal Index of your favorite stocks, since it is updated each day for all the stocks that are traded on NSE in the mainboard segment.
We hope you enjoyed this three part series, where we analyzed Varshik Bal and associated potential upside, downside risks and net upside, balancing risk and reward.
Until next time, happy investing and stay in touch – Sign Up to our newsletter now!
Note: Stock market investments are subject to market risks. Past performance is not indicative of future results. The above should not be treated as investment advice. Please read the full disclaimers here.