
Wealth Wisdom – Evaluation of Downside Potential
Welcome to the next post of our Wealth Wisdom series, as we continue exploring the relationship between Varshik Bal (Annual StockBal) and the potential returns. In the previous post, we had analyzed the upside potential of stocks across the range of values of Varshik Bal. Now, in this post, we shall analyze the downside potential across the entire spectrum of values of Varshik Bal. The Varshik Bal is one of the components of StockBal, that is updated daily and measures the relative strength of a stock compared to the broader market across three timeframes – Annual (Varshik Bal), Monthly (Masik Bal) and Weekly (Saptahik Bal).
Our Analysis Methodology
The analysis methodology followed has been explained in detail in the previous post on the upside potential of the Annual StockBal. However, here is a brief summary once again.
The potential upside returns were computed by measuring the difference between the closing price, and the maximum of the high price of a stock over the next 30 trading days (roughly six weeks). Similarly, we will now look at the potential downside returns as the difference between the closing price, and the minimum of the low prices of the stock over the next 30 trading days.
We have analyzed this metric of downside potential for 500 stocks spanning around 15 years and over 14 lakh data points. The average downside potential across all these data points is (-) 8.9%. So, in this post, we will explore the values of Annual StockBal that are associated with downside potential and compare it with the baseline of (-) 8.9%.
Quick Recap: Varshik Bal and Upside Potential
In the previous post, we had shared that the potential upside returns are higher at both ends of the range of Varshik Bal. So, the upside tends to be higher than the baseline when the Varshik Bal is either between 0-10 or between 80-100. You can refer to the detailed post on the upside potential by Varshik Bal for more insights. However, let us now focus our attention on the downside risk.
Measuring Downside Risks
In doing so, we will continue to divide the spectrum of Annual StockBal values in bands of 10, resulting in ten bands, starting from 0-10 upto 90-100. Since our StockBal Dashboard classifies the StockBal into three bands of High (>66.66), Medium and Low (<33.33), we will also share the results across these three zones.
Downside Potential Across The Entire Annual StockBal Spectrum
So, here is the chart that shows these 10 bands on the X-axis and the downside potential i.e. maximum possible fall over 30 trading days on the Y-axis. Kindly note that since we are only looking at downside, the Y-axis has negative values only.
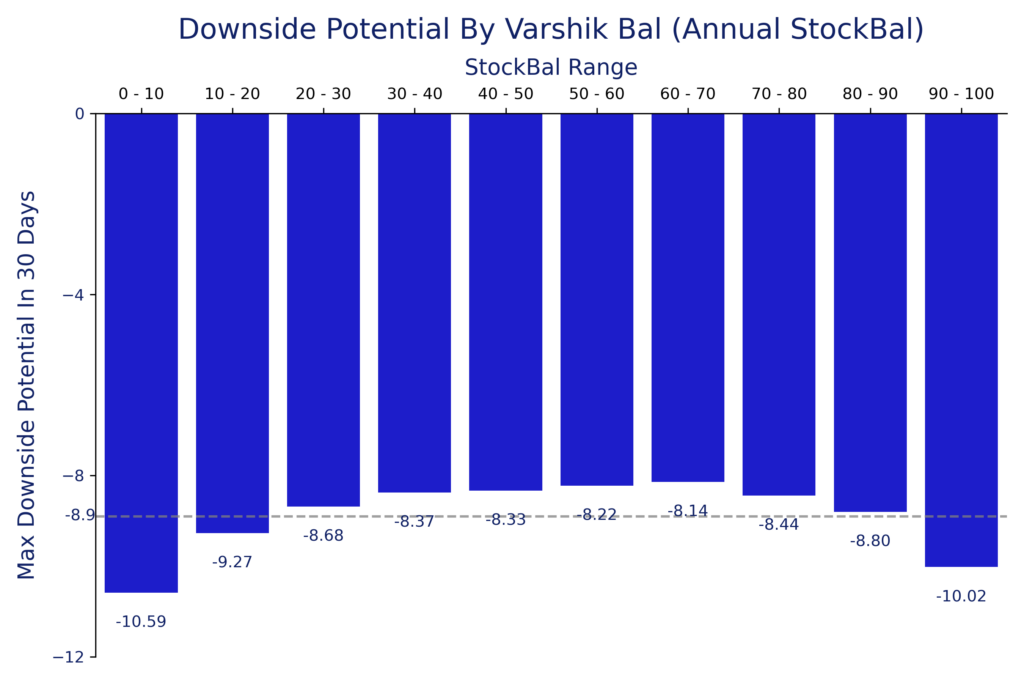
As you can see from the above chart, the risk appears to be highest at both ends of the Varshik Bal range. There are only three bands out of the total 10 bands of Varshik Bal, where the downside potential is more than the average – 0-10, 10-20 and 90-100. The downside risk is the highest at (-) 10.59% when the Varshik Bal is less than 10.
If we look at the High, Medium and Low values of Varshik Bal, as reported in our StockBal dashboard, we find that the greatest downside potential is associated with Low Varshik Bal (<33.33), when the downside is (-) 9.37%, as compared to the average downside of (-) 8.9%. The corresponding figure is (-) 9% when the Varshik Bal is in the High zone (>66.66). As one can expect by looking at the chart, the least downside potential of (-) 8.26% is associated with the Medium Zone, when the Varshik Bal is between 33.33 and 66.66.
If we divide the Varshik Bal into two halves, we find that the downside potential at (-) 9.02% is more when the Varshik Bal is less than 50, as compared to the downside risk of (-) 8.72% when the Varshik Bal is higher than 50.
Will This Pattern Repeat In The Future?
The above inferences are drawn from a reasonably long period of time, and across a diverse set of 500 different stocks. However, it is worth pointing out that past patterns may not repeat in the future. In fact, the same broad based patterns may not hold true for some stocks, or for certain periods of time, depending on various factors.
This is merely a fact-based analysis of the past performance, and should be treated as such. However, we do believe there is merit in adopting an approach of data-driven decision making, rather than relying on tips, hearsay and blindly following theories that are not backed by data and analysis. That being said, typically there is no silver bullet or a single metric that can help us take our decisions, and one should not hold any indicator or metric to such standards.
We need to combine our observations from many different sources, before taking a decision, and it is recommended to use the services of a registered research analyst or investment advisor to navigate the complex world of trading and investing.
Balancing Upside and Downside Potential
On that note of combining observations and different perspectives, one needs to look at the net effect of the upside and downside potential of stocks, while reviewing the impact of Varshik Bal, or any other indicator or metric.
We will continue with our analysis of potential returns that are associated with various levels of the Varshik Bal in our next post of the Wealth Wisdom series, where we will look at the net impact.
This will follow the same approach that we had followed in our analysis of returns based on the levels of RSI (Relative Strength Index), one of the most popular technical indicators. We looked at over 14 lakh data points to determine whether past performance supports the hypothesis that stocks are overbought when RSI is above 70, and whether they are oversold when the RSI is below 30. This was done through a serries of three posts as part of the Wealth Wisdom series:
- Upside Potential across all values of RSI
- Downside Potential across the range of RSI values
- Net Impact and Risk-Reward profile based on a combination of the above
While the RSI is available across many different platforms, the StockBal (including Varshik Bal, Masik Bal and Saptahik Bal) is available exclusively on the StockBal dashboard on our website.
Concluding Thoughts
If you follow the data-driven approach of trading and investing, we trust you are finding loads of value and insights from our Wealth Wisdom series. We have effectively validated or invalidated theories that have been around since the 1970’s, with data drawn from 500 stocks that have traded in the Indian stock markets from 2010 to 2024, i.e. around 15 years, spanning around 14 lakh data points.
While we are proud of the extensive work that has been done to provide you with these insights, we would not want you to go away believing that you now have the secret sauce to beat the markets. We would like to humbly remind you that there is no such thing as the secret sauce or a winning formula that wins every time.
In particular, past performance is not a guarantee of future results, and one should always consult a trusted and registered advisor, while remaining cognizant of the fact that stock market investments are subject to risks. And, as almost everyone now knows, more than 90% individual investors have lost money while trading in futures and options.
Such extreme pain to our retail participants is the reason why we have started this platform. There are many pathways to address the underlying issues, and access to genuine data-driven insights (instead of so-called hot tips) is one of the mechanisms to empower the retail participants.
If you subscribe to this data-driven approach, please do share these insights and the details of the StockBal dashboard with people in your network. Kindly note that StockPatri does not provide any stock specific recommendations, or investment and / or trading ideas. We only provide analytics and insights that have been drawn from past performance, and we do not make forward looking statements or predictions on future performance or potential of stocks. You can refer to the disclaimer in this regard in our terms and conditions.
Hope to see you, and more people from your network, in the next post of the Wealth Wisdom series, where we will analyze the net impact on returns across the entire range of values of Varshik Bal, combining the observations outlined in this post and the previous post on the upside potential associated with the Annual StockBal.